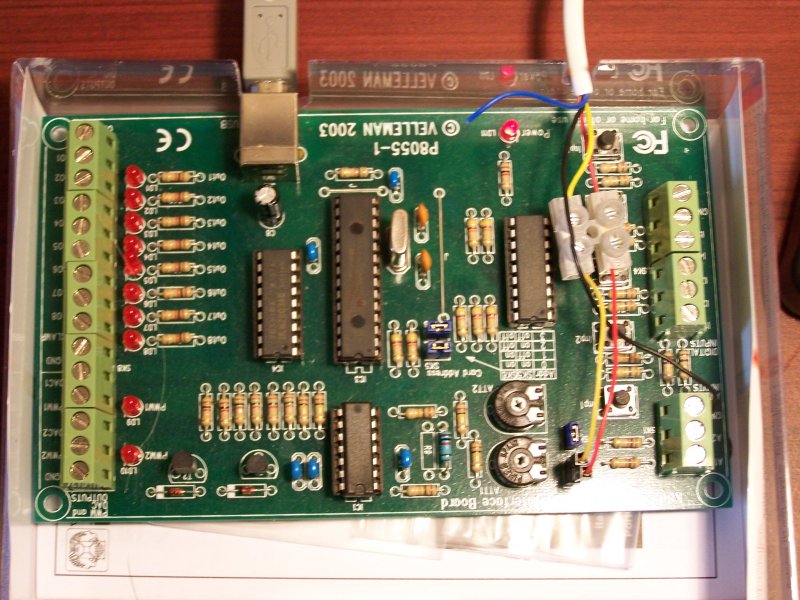
First version of the 'Temperature Monitor'
In addition to the camera video, this site now includes live temperature data to be viewed (see Index Page). An IC type temperature sensor feeds analogue data to a Velleman USB/IO interface. The digital data is processed using simple VB program code. This allows sampling to be scheduled at specific time intervals and will save the data as a text file. Date and time stamping is stored with each data sample. The data file provides a useful record of the temperature variation for graphical display.
A second data file is saved and the temperature data is read into a variable by a short PHP code segment in the index page.
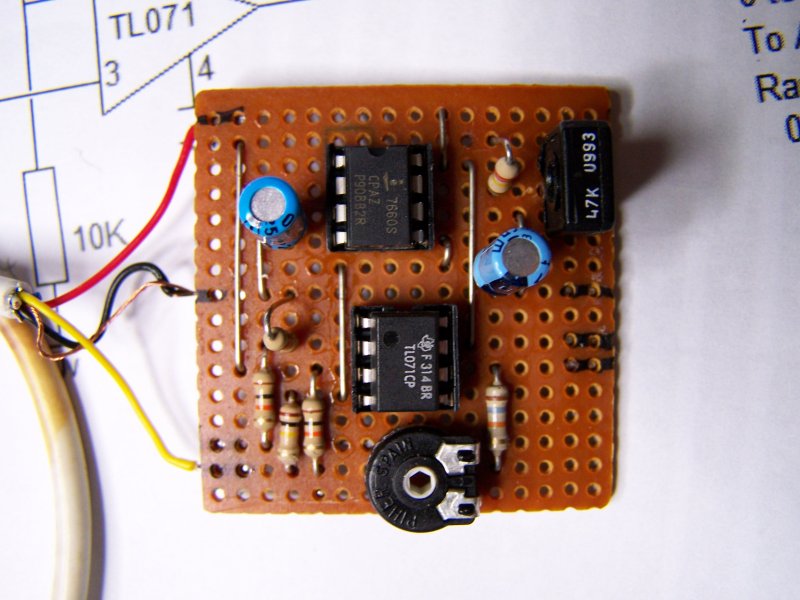
The next stage was to modify the temperature sensing to allow negative temperature incursions to be logged. This required a negative voltage to be generated from the +5v (USB) supply.
An ICL7660 IC provided the -5v and an TL071 op-amp to buffer & scale the analogue output. The final design provides a range of -15 to +35 degress (C). The linearity should be within 1%, and despite no temperature compensation for the op-amp, the measurements are within +-5%
Second version.... With the repacing of the (Desktop style) PC server with a Raspberry Pi, a new approach to 'data logging' the temperature was introduced.
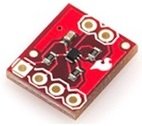
I started with help from the 'Magpi' - the magazine supporting the 'Pi' and its many users. I found an article entitled 'Interfacing the TMP102 breakout module'. The TMP102, manufactured by Texas Instruments, is an 'I2C' connected temperature module. It provides an excellent way to learn about interfacing with I2C bus devices. The device (sensor) is mounted on a tiny PCB with just 4 connections V+, Gnd, SDA (data line - out) and SCL (clock line). The device cost less than £5 and is capable of very accurate measurement (see: http://www.ti.com/lit/ds/symlink/tmp102.pdf for the datasheet).
The article included some fundamental Python language together with script code for uploading the readings to C.O.S.M. (now called 'Xively' see: https://xively.com/ ). This provided a way of recording & displaying the data via the Internet.
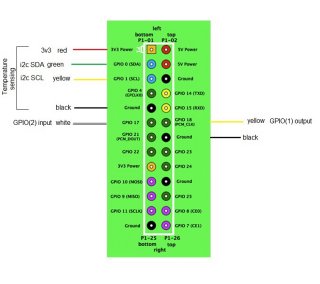
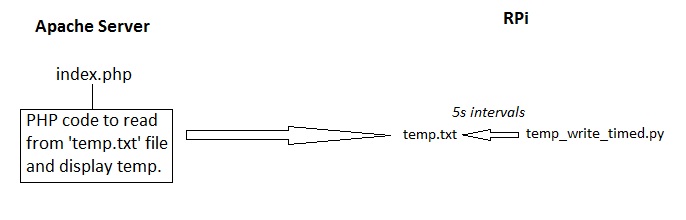
. The simple flowchart below, shows the passage of the I2C temperature data through the Pi's GPIO to be saved in a text file on the Pi Server. PHP code embedded in the website page reads from the text file and dsiplays the data. This is refreshed each time the page ('index') is retrieved.
I2C interfacing = 4 connections
The data is uploaded to the Xively site hourly. Historical data can be retrieved in numeric or in a graphical form. The graphical data can be displayed 12 hourly, weekly or monthly while the numeric records can be downloaded into an application such as Excel. All code used, available on request.
------------------